|
|
| ||||||
Helpful Resources:
- How to Design, Build, and Test Small Liquid-Fuel Rocket Engine (ROCKETLAB / China Lake)
- This book is a step by step playbook for creating your own small scale rocket engine. Many of the equations and tables are great references for give you a realistic idea of what is possible to be built at this scale with limited resources.
- Design of Liquid Propellant Rocket Engines, Second Edition (Huzel, Huang)
- This book goes much more in depth to how actual rocket engine design and development is carried out in industry. It will be an extremely help asset for helping with Injector Design, to pulling every last bit of ISP out of your engine as possible.
- Flow of Fluids: Through Valves, Fittings and Pipe (Crane)
- This book is a great reference for helping to calculate various parameters within the feed system. It also provides most equations needed for orifice sizing.
Sizing Orifices of an Injector
One of the biggest tasks to tackle with designing your own Liquid Rocket Engine is with designing your injector plate. This plate is composed of holes that will allow a certain amount of the two propellants to enter the combustion chamber. But coming up with the area of these orifice holes takes some background knowledge and some computing power.
Things you will need to know prior to this calculation are:
The most helpful tools you will learn from this lesson is how to run NASA CEA and use Valcor's Flow Calculator Tool.
NASA CEA is an amazing tool that handles a lot of the intensive thermodynamic and chemical mathematics of us so that we can just focus on designing and manufacturing our engine. Also, to try to get a very good approximation of what the results we will be getting from NASA CEA will be very difficult and to verify your own calculations will be an even more difficult process. NASA CEA however is highly utilized in industry and has been verified to be a good approximation.
Valcor Engineering Corporation has created a very useful tool for figuring out desired Flow Area based on initial parameters. It also has an extensive database of thermodynamic and properties of various fluids we may encounter.
Things you will need to know prior to this calculation are:
- Desired Fuel & Oxidizer Fluids Types & Phase
- Upstream pressure of each of the propellants (Feedline Pressure)
- Chamber Pressure
The most helpful tools you will learn from this lesson is how to run NASA CEA and use Valcor's Flow Calculator Tool.
NASA CEA is an amazing tool that handles a lot of the intensive thermodynamic and chemical mathematics of us so that we can just focus on designing and manufacturing our engine. Also, to try to get a very good approximation of what the results we will be getting from NASA CEA will be very difficult and to verify your own calculations will be an even more difficult process. NASA CEA however is highly utilized in industry and has been verified to be a good approximation.
Valcor Engineering Corporation has created a very useful tool for figuring out desired Flow Area based on initial parameters. It also has an extensive database of thermodynamic and properties of various fluids we may encounter.
How to Calculate Desired Total Impulse
Let's consider the following example:
I have a rocket with a combined wet and dry mass of 100 lbs. I need the rocket to reach 1 mile in amplitude. How much impulse will I need-- with the assumption that the mass of the rocket never changes and that aerodynamic drag forces are zero?
I have a rocket with a combined wet and dry mass of 100 lbs. I need the rocket to reach 1 mile in amplitude. How much impulse will I need-- with the assumption that the mass of the rocket never changes and that aerodynamic drag forces are zero?
- Let's first convert our imperial units over to more equation friendly metric units:
- mass = 100 lbs ~ 45.36 kg
- height = 1 mile ~ 1609.34 meters
- We first need to calculate a term known as "delta-v" (ΔV), we can get this value by rearranging the conversation of momentum equation:
- Potential Energy = U = (mass) * (gravity) * (height)
- Kinetic Energy = K = (1/2) * (mass) * (velocity)^2
- Conservation of momentum: U = K
- velocity = sqrt ( 2 * (gravity) * (height) )
- ΔV = velocity
- In our case we'd need a ΔV of ~ 177.6 m/s
- Now that we have delta-v we can now calculate Impulse
- Impulse = J = (mass) * (ΔV)
- So in our case J ~ 8,054.16 N s
How to figure out Desired Chamber Pressure
This is a very mechanical question, and relies highly on what is available to you for use. While generally higher chamber pressure will yield a higher ISP, it comes at the cost that the chamber needs to be able to handle the excessive pressures and temperatures without fail, which tends to come at the cost of higher chamber design complexity and added weight. This is a situation where it is more helpful to reference publications from other trustworthy sources like How to Design, Build, and Test Small Liquid-Fuel Rocket Engine (ROCKETLAB / China Lake) to get an idea of what possible performance is possible to be extracted from commonly accessible materials. See pg.18-22
At a minimum your chamber pressure needs to be high enough to avoid a reverse flow situation from occurring due to combustion instabilities. A combustion instability occurs when uneven mixing creates local pockets of unmixed propellent which in turn create miniature pops when combusted. These pops create a pressure fluctuation in the chamber which can be higher than your feed pressure, and thus cause a reverse flow scenario. A good rule of thumb is to have a pressure ratio (Feed Line Pressure : Chamber Pressure) of 2, this will ensure that your fluid will choke across the orifice plate, preventing a reverse flow event from the combustion chamber back into the feedline. It is important to note that while a pressure ratio of 2 is a safe rule of thumb, it is not ideal. The higher your pressure ratio the more pressure you are dropping and thus you are missing out on performance. If you get to a point later down the road where you can verify that proper mixing is occurring (you aren't seeing massive dynamic pressure fluctuations in the chamber that exceed the delta between your feedline pressure and your chamber pressure) you can then consider dropping your pressure ratio accordingly to get more ISP out of your engine.
For the sake of this tutorial we will be assuming a chamber pressure of 300 psia.
How to figure out ISP for Initial Sizing
Now that we have an idea of our desired impulse, we need to know prior to figuring out the mass flow rate is our estimated specific impulse (Isp). Without actually testing a built engine, figuring out your engine exact Isp before hand is next to impossible. There are so many parameters relating to the engine's performance that will dictate what your Isp ends up being. Our best bet is to utilize theoretical models and historical data for similar engines/propellant combinations to give us a good ball park Isp value. Once we have our first engine built, we can see how far off we are in ISP/Impulse.
Let's assume for this example that we pick a LH2/LOX (Liquid Hydrogen / Liquid Oxygen) propellent combination. There are equations out there that will bound what the theoretical maximum is for ISP of a given propellent combination just based off of characteristics of the propellents (assuming perfect mixing to where every molecule of fuel is mixed with the corresponding amount of oxidizer before combusting in the chamber). Typically you can find ISP tables like the one I'm about to show you in various textbooks (like pg.34 this one)
Let's assume for this example that we pick a LH2/LOX (Liquid Hydrogen / Liquid Oxygen) propellent combination. There are equations out there that will bound what the theoretical maximum is for ISP of a given propellent combination just based off of characteristics of the propellents (assuming perfect mixing to where every molecule of fuel is mixed with the corresponding amount of oxidizer before combusting in the chamber). Typically you can find ISP tables like the one I'm about to show you in various textbooks (like pg.34 this one)
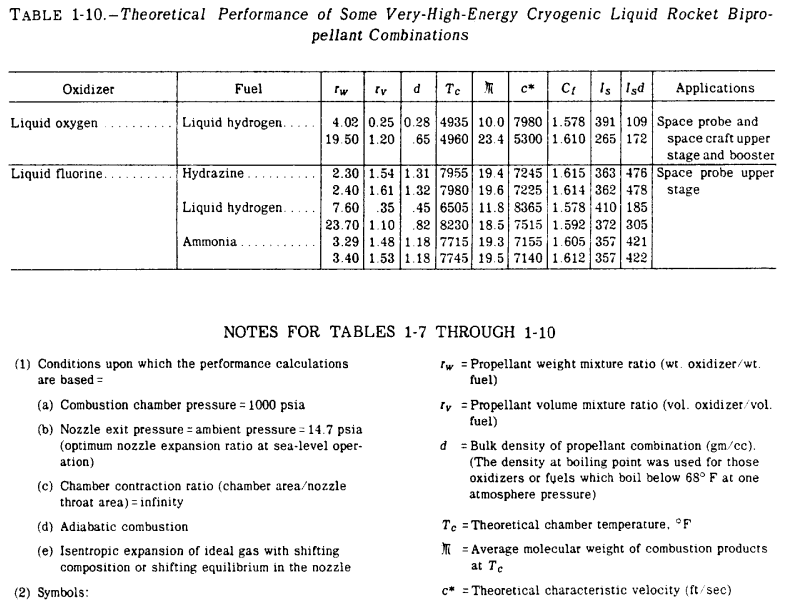
From this table we can see that LH2 and LOX together can produce a theoretical maximum ISP at a corrected Chamber Pressure of 300 psi would be:
- ISP @ 300psia Chamber Pressure = 391 [s] * 0.88 = 344.08
- J = ISP * g * Integral(mdot)
- Integral(mdot) = J / (ISP * g)
- Integral(mdot) = (8,054.16 [N s]) / (344.08 [s]) (9.81 [m/s^2]) ~ 2.386 kg
- mdot(total) ~ 2.386 kg
How to figure out O/F Ratio
The O/F Ratio is the ratio of how much mass of oxidizer per mass of fuel is sent into the injector plate. We will need to know the material properties of the chamber to make an accurate estimation of what temperatures are able to be used for our chamber wall at our given chamber pressure. This is where NASA CEA will be used.
Running NASA CEA
Go ahead and input your Total Mass Flow Rate which you should know based off your feed system or simply estimate this right now. Then you may not know what your O/F ratio is until we run NASA CEA.
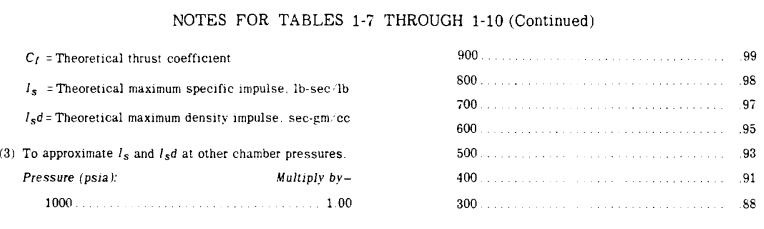
Go to the Following Website to run NASA CEA: https://cearun.grc.nasa.gov/
Go ahead and input your Total Mass Flow Rate which you should know based off your feed system or simply estimate this right now. Then you may not know what your O/F ratio is until we run NASA CEA.
Go to the Following Website to run NASA CEA: https://cearun.grc.nasa.gov/
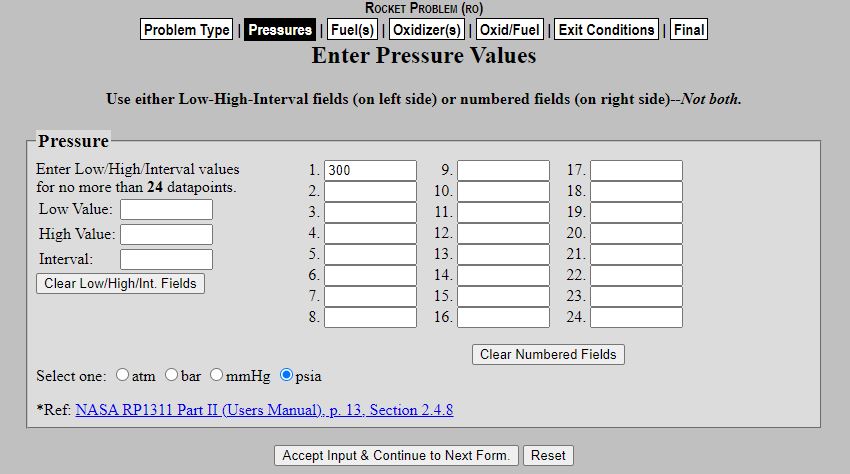
Make sure you have rocket selected and Hit the "Submit" button.
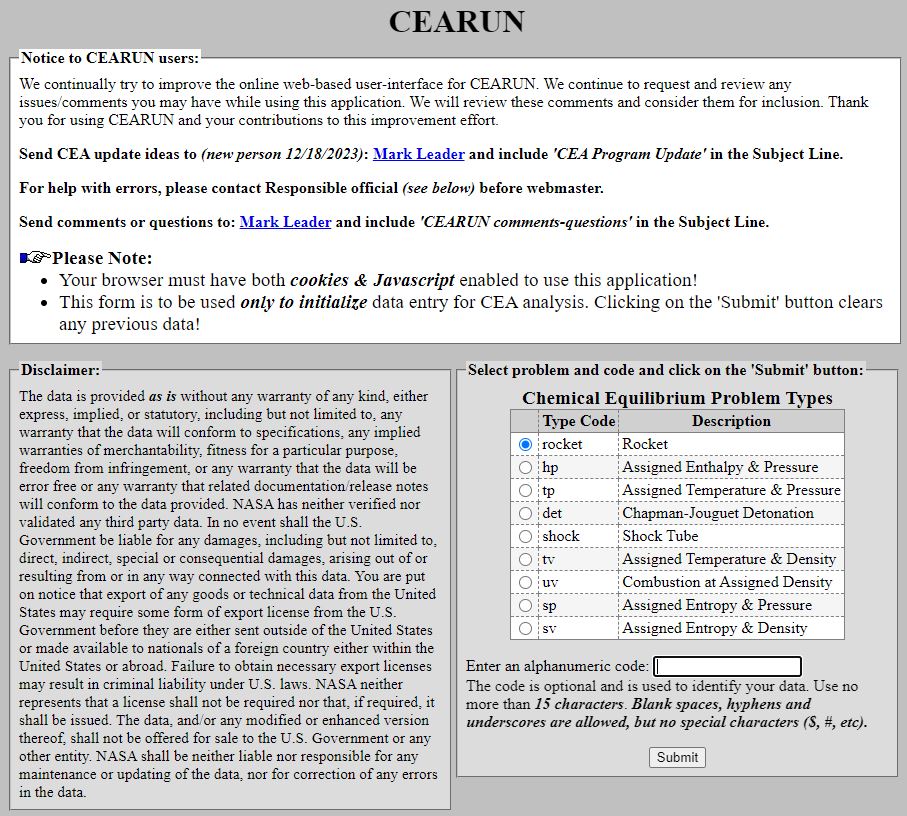
In the Pressures section we are imputing our combustion chamber pressure. Also ensure that psia is the units selected
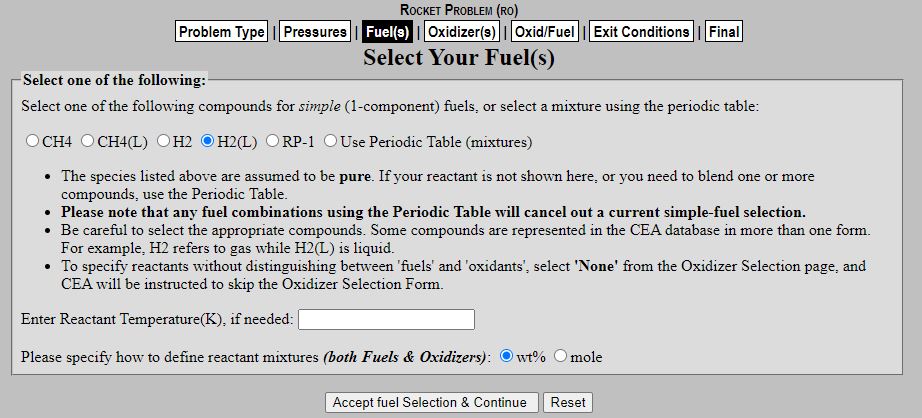
Here we will input our fuel parameters. In my example we will be using liquid Hydrogen as our fuel, keep in mind the (L) indicates the fuel being in Liquid state. Choose from the following fuels and hit "Accept Fuel Selection & Continue"
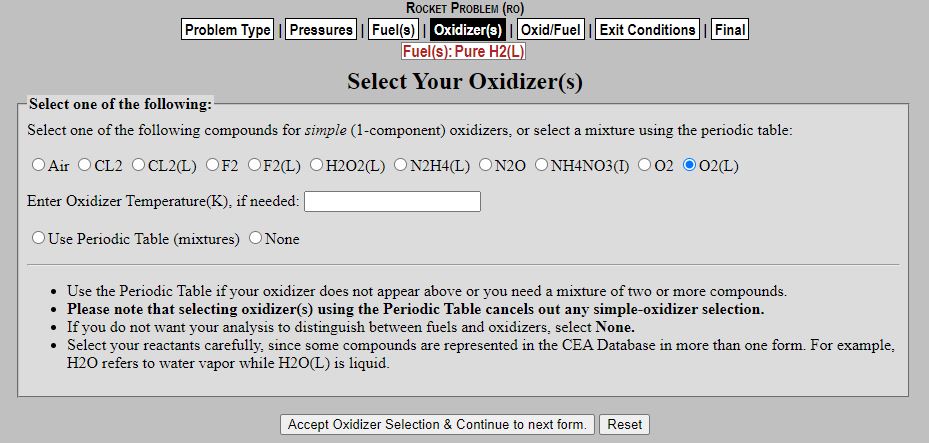
Here we will state our oxidizer parameters. For my example run we will use Liquid Oxygen (LOX) as our oxidizer, but for your case indicate whatever oxidizer you are choosing to use. Hit "Accept Oxidizer Selection & Continue to next form."
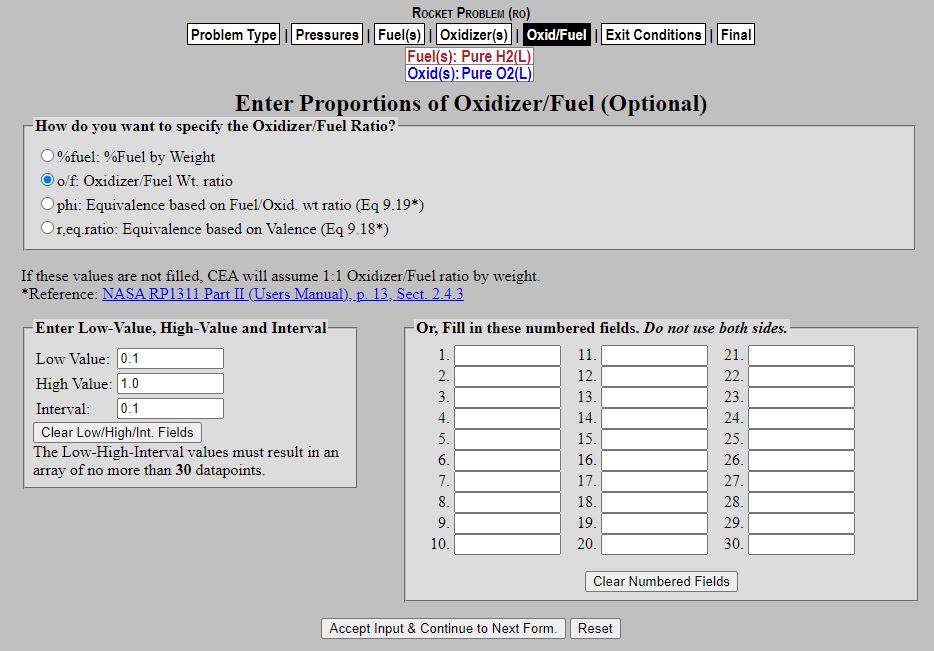
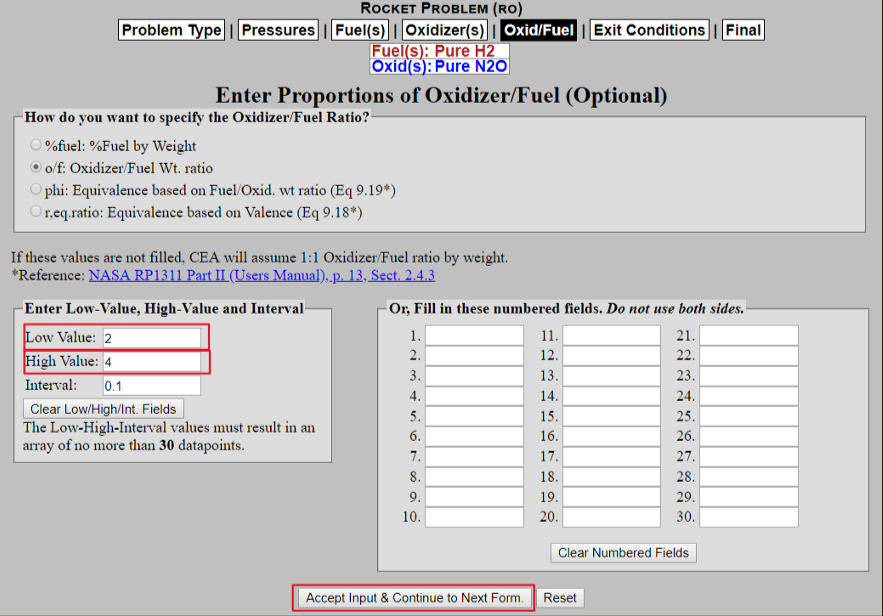
In this tab, we will be putting in the range of O/F values we want NASA CEA to test for us. Make sure the "o/f: Oxidizer/Fuel Wt. ratio" option is selected. Hit "Accept Input & Continue to Next Form." We will start with a Low Value of 0.1 and a High Value of 1.0 with an interval of 0.1. Hit "Accept Input & Continue to Next Form."
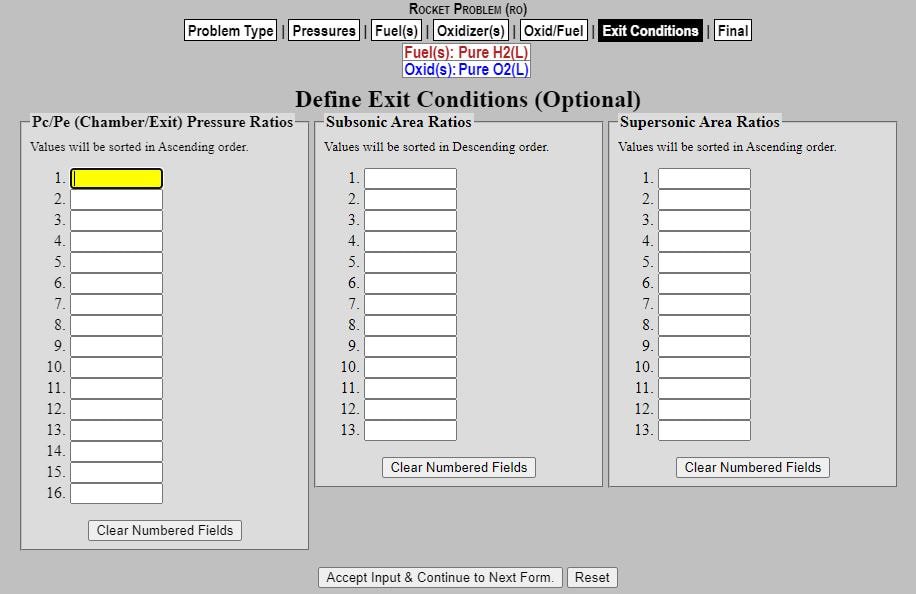
In this tab, we will be doing nothing since we are having NASA CEA solve for these parameters. Hit "Accept Input & Continue to Next Form."
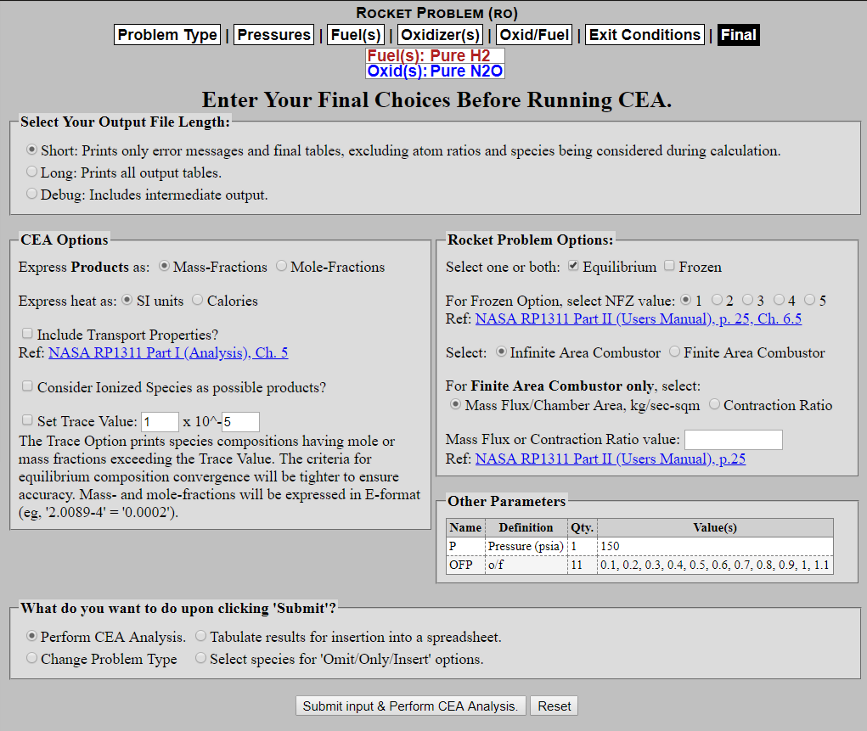
Now we need to specify the output data specifications, which alone are already fine. No need to change anything, just hit "Submit input & Perform CEA Analysis."
|
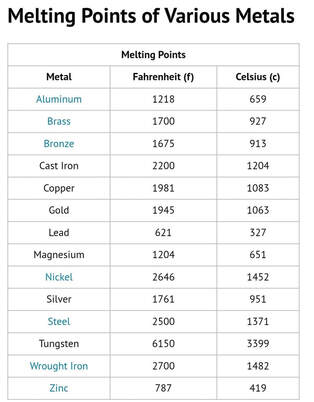
The next thing we need to understand before analyzing the results is in looking at the material capabilities we will be using. For example, since we will be using stainless steel we need to consider the melting point and need to make sure our NASA CEA results for engine temperature stay well below that melting point. Looking at the chart to the left, you can see the melting point of different metals. Knowing what the Melting point of your material, we need to use a safety factor of 1.5 or greater. For our case, we are using stainless steel which as a melting point of 2500 F. So the maximum temperature we can have our engine reach is (2500 F) / 1.5 = 1666 F, and we can round that down to 1600 F. So as long as we stay under that value we will be fine. Further analysis can be done in analyzing the change in yield strength of the material at that temperature, but with this safety factor the yield strength should not have shifted considerably.
|
Now that we understand our temperature range, we need to cover the first aspect NASA CEA will provide for us. This will be the O/F ratios. Essentially as we mentioned before, we don't really know what our ideal O/F ratios are, which is why NASA CEA is so powerful in being able to generate all permutations of our specified parameters. O/F has a direct correlation to the temperature of combustion similar to what you can see from the graph shown below. You can see that the highest point of temperature is known as the "Stocheometric Ratio" which also indicates that there exists just enough oxidizer to mix with all of the fuel need. The more oxidizer you add in after that point the temperature will start to decrease again which means there is wasted oxidizer. The more wasted propellant the less efficient your engine is since that propellant has the potential to add more energy to the system through combustion but is just exhausted out the nozzle. Higher the temperature the higher you engine's combustion efficiency will be.
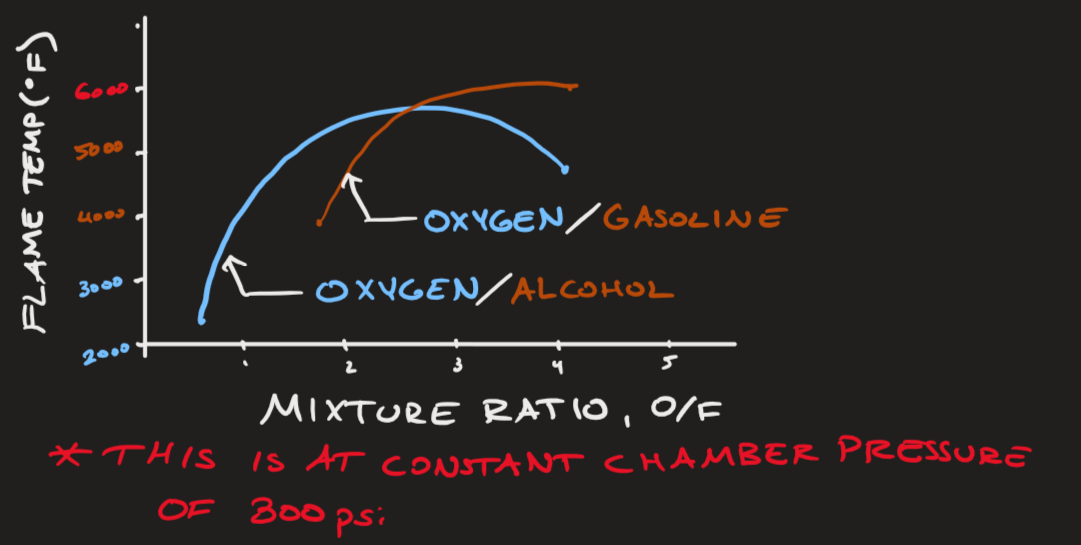
You can tell just from this exaggerated graph how to O/F ratio is related to the temperature the flame will be at and be transferred to the engine material. In reality we really are more constrained to the melting point of our material than the ability to have combustion at the Stoichiometric ratio which is generally the bigger bottleneck for most metals.
Ok, now we can go ahead and look at NASA CEA's results. As you scroll down you will be able to see each individual permutation of O/F ratios.
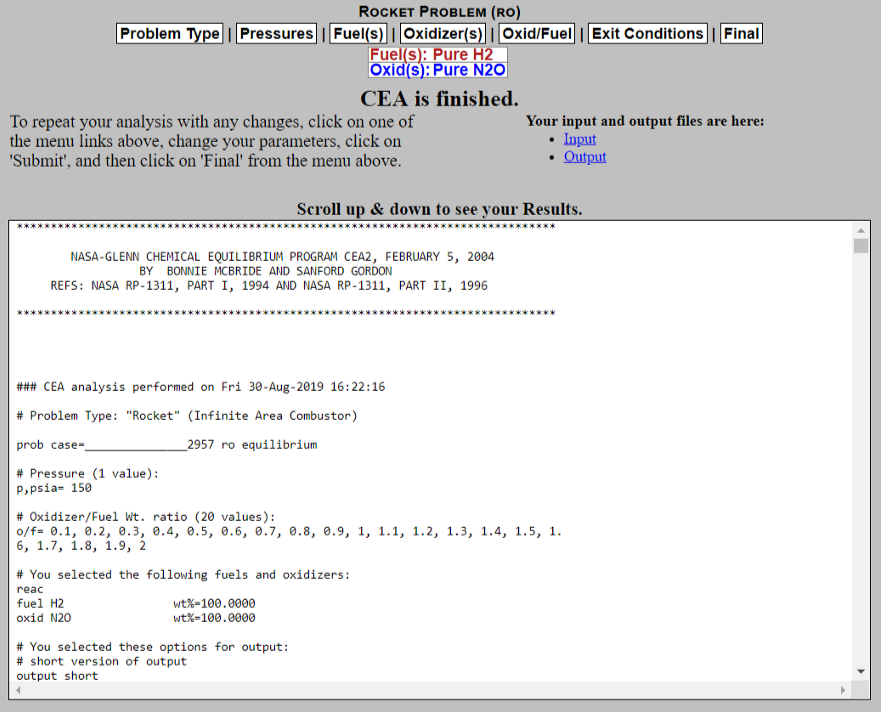
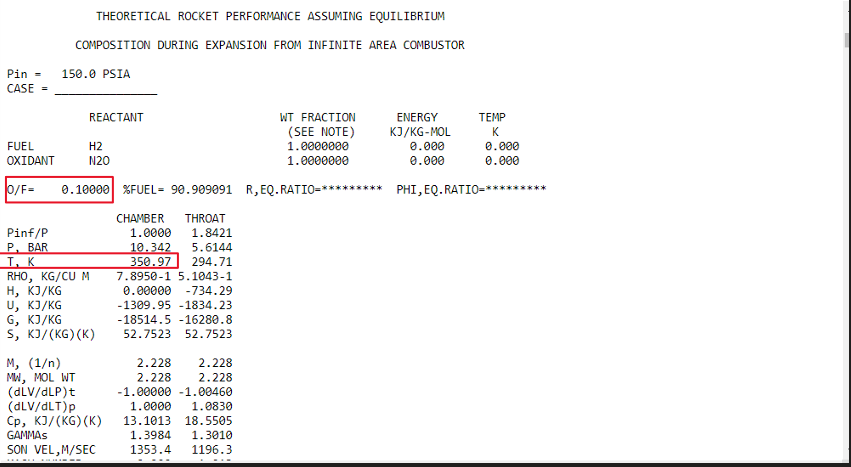
You can see as indicated above where our two values of interest are: our O/F ratio, and the achieved chamber temperature, we are more so looking at the chamber temperature since it will tend to be higher than the temperature of the nozzle throat. So the result above tells us that at an O/F ratio of 0.1 the resultant temperature in the chamber will be approximately 350 F. Let's keep scrolling down and see how close we can get to our maximum temperature limitation.
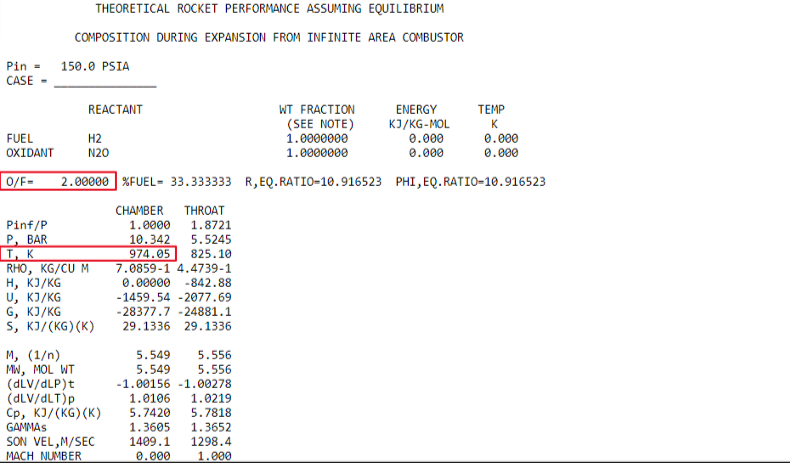
From what you can see above we have reached the upper limit of our O/F range and our chamber temperature still could be closer to our maximum temperature. So we have to go back to the "Oxid/Fuel" tab at the top and make some changes as seen below:
Still too low....
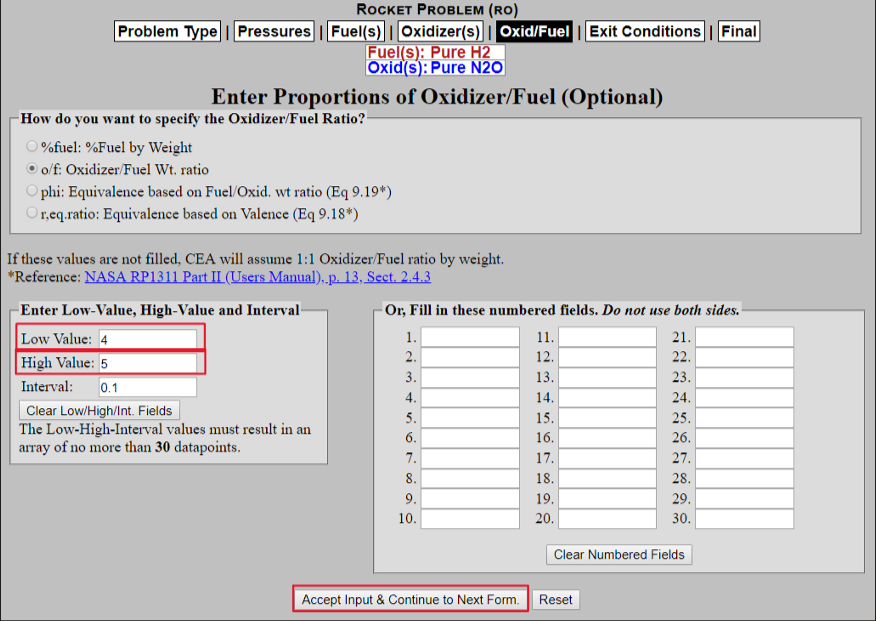
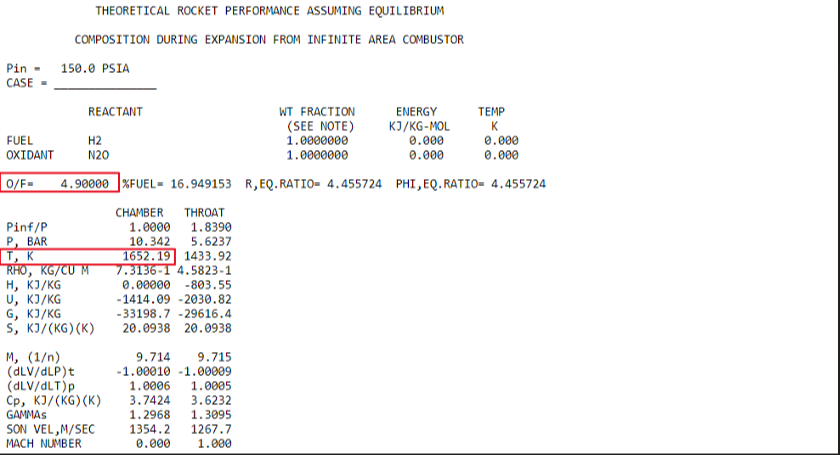
Great we are close enough for now. But if you wanted to get even closer, we could refine the interval of our O/F parameters and rerun it. But we will go ahead and use this data: O/F ratio of 4.9
Making our Excel Spreadsheet
Start with creating a Google Spreadsheet with the following layout:
This setup contains all of the starting layout you will need, you can just use the following link to copy the layout:
This setup contains all of the starting layout you will need, you can just use the following link to copy the layout:
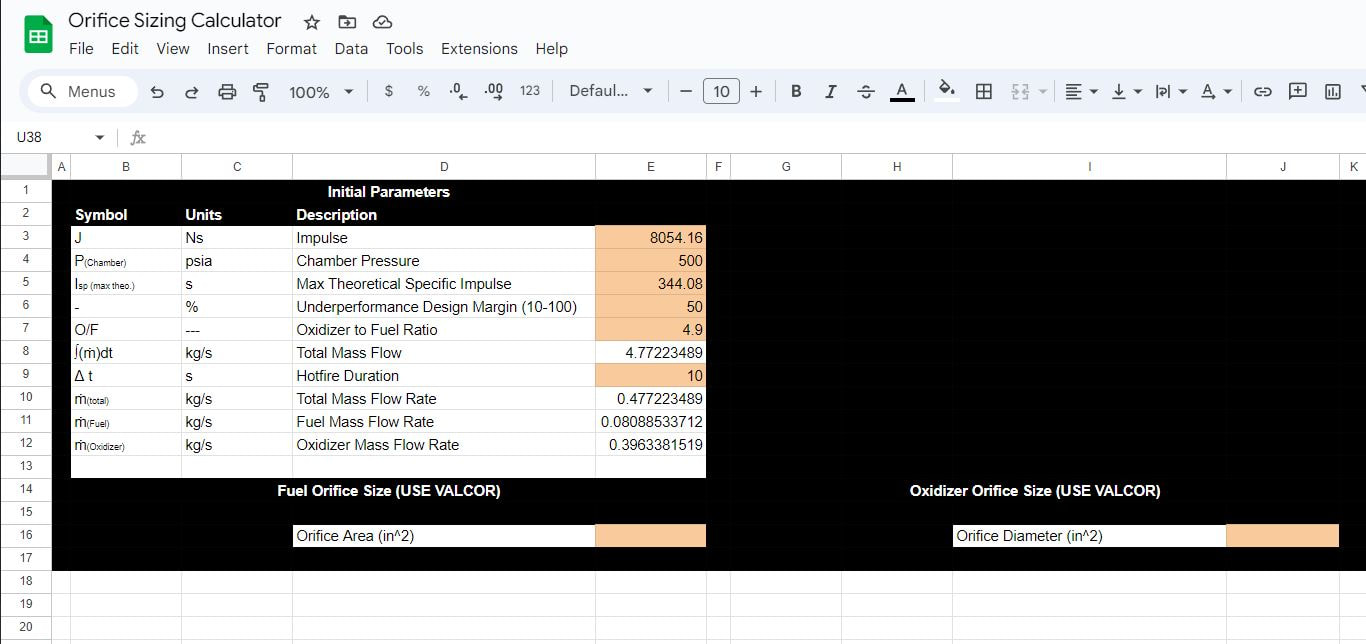
Using the parameters we've calculated thus far, input these into the spreadsheet. Note for this example we will assume a hotfire duration of 10 seconds, this is how long your engine will be firing for in seconds. This typically will be limited due to your chamber wall's capability to not fail from excessive heat in the chamber. We will also be using an underperformance design margin to factor in the fact that our engine will likely not perform at the expected maximum theoretical ISP. With this margin we can factor in the error we are likely to experience during testing and will allow us to upgrade in the future.
Using Valcor's Flow Calculator
Simply download the flow calculator here. Once you have downloaded it open the .exe file.
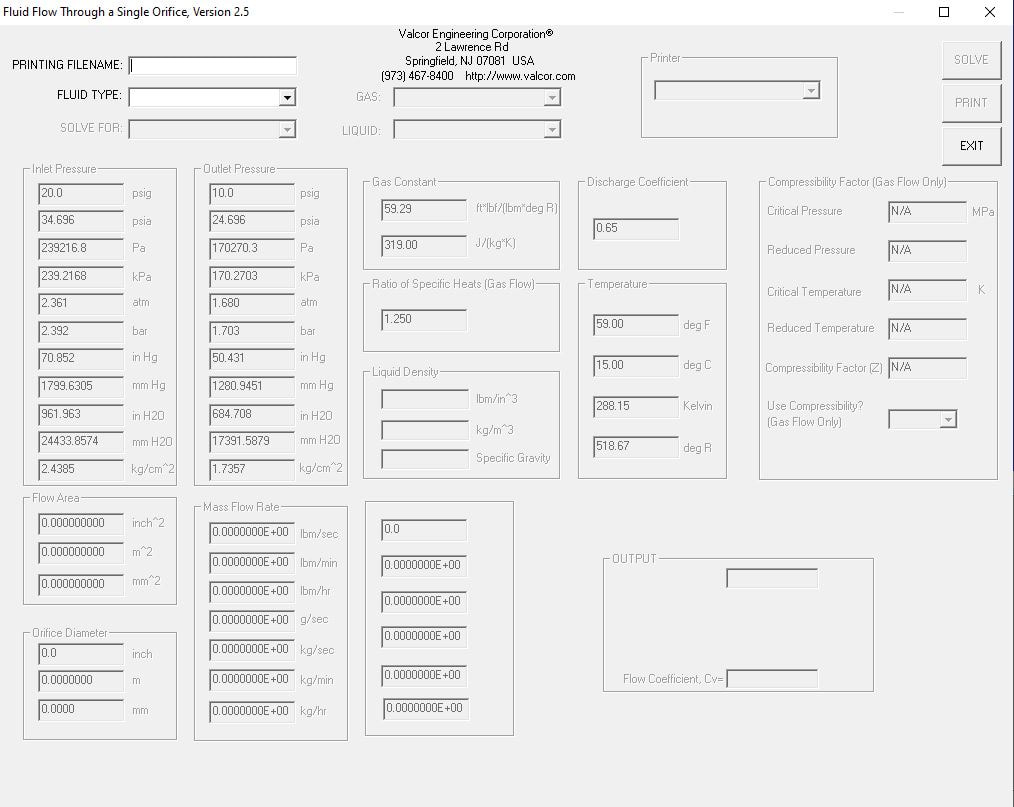
- PRINTING FILENAME: Add a File Name for the output to get fed into
- FLUID TYPE: Select your Fuel Fluid Type (Either Liquid or Gas)
- SOLVE FOR: Flow Area/Orifice Diameter
- GAS OR LIQUID: Select the Fuel you are using
- Inlet Pressure: Input Feed Line Pressure (In our case x2 the chamber pressure) [psia]
- Outlet Pressure: Input Chamber Pressure [psia]
- Mass Flow Rate: Input the mdot total from the spreadsheet [kg/s]
- HIT ENTER
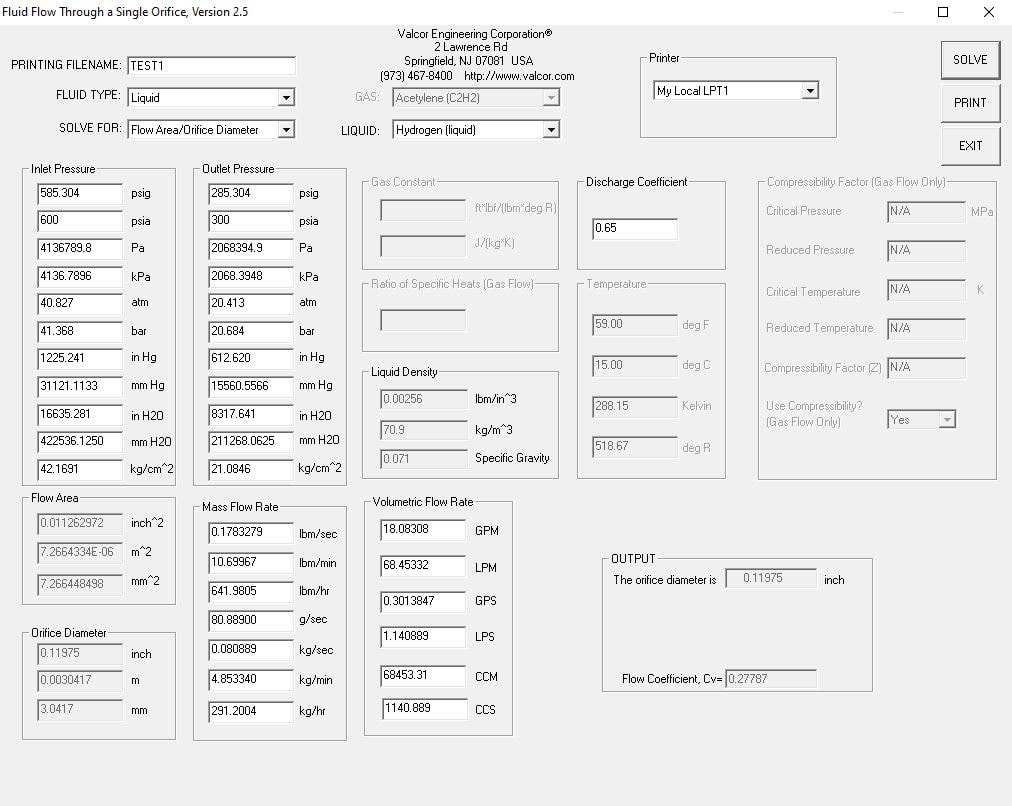
Perform the same solve for your oxidizer by changing the LIQUID and the Mass Flow Rate parameters:
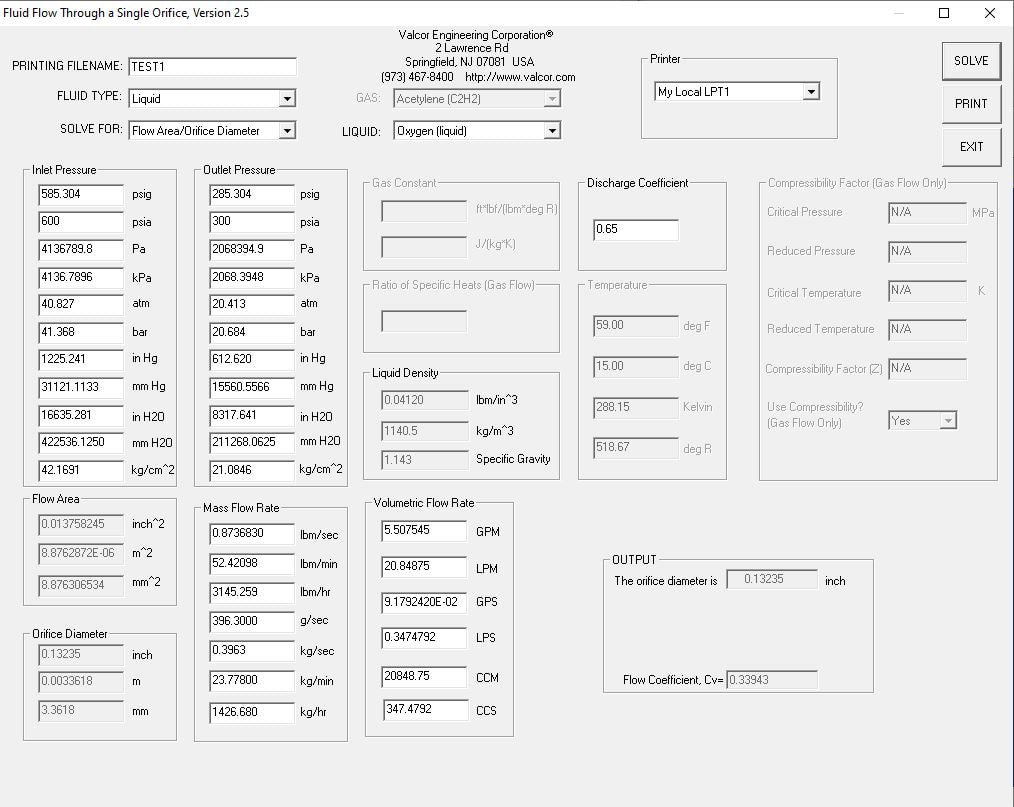
Based on our outputs we are looking at a flow area of:
- Fuel: 0.01126 [in^2]
- Oxidizer: 0.01376 [in^2]
Now that we've figured out the respective flow areas for both the fuel and oxidizer we can now begin to design the injector plate. We could at this point simply create an injector plate that feeds the oxidizer and fuel into the chamber using the orifice hole diameters specified in the Valor program output. However, there is more to injector design than just the orifice diameter. The propellent need to mix in order for your combustion efficiency to be anywhere near the theoretical maximum as well as to avoid combustion instabilities.
See pg 121-131 of Huzel and Huang for more on how to design a proper injector to optimize for performance.
See pg 121-131 of Huzel and Huang for more on how to design a proper injector to optimize for performance.